A pinhole coolant leak reduces system pressure by 1.5 PSI to 2.0 PSI before any puddle appears on the ground. That pressure drop shifts OBD-II coolant temp PID oscillation from a normal 5°F to 8°F band to 12°F to 18°F within the first 10 minutes of a drive cycle. Telematics systems logging PID data at 1 Hz identify that deviation window before the driver’s gauge moves.
What Telematics Systems Actually Measure in a Cooling Circuit
Modern telematics platforms do more than track location. They log OBD-II PID data continuously, including coolant temp, engine load, and idle duration per drive cycle.
A healthy cooling system produces a stable coolant temp PID signature. At operating temp, readings oscillate within a 5°F to 8°F band as the thermostat cycles open and closed. That pattern is consistent across makes and models under normal pressure conditions.
A pressure deficit changes that pattern. When system pressure drops below 11 PSI from a developing leak, the coolant boiling point drops by approximately 14°F to 18°F. The thermostat cycles faster. The PID oscillation band widens. That widening is the first measurable signal a leak is forming.
Diagnostic Verdict: On vehicles with confirmed pinhole leaks, PID logs from the 10 minutes prior to the service visit show coolant temp oscillation bands of 12°F to 18°F, compared to the 5°F to 8°F baseline recorded on the same vehicle six months earlier.
How a Pinhole Leak Changes Your Coolant Temp PID Pattern
Most drivers assume a coolant leak only matters when a puddle appears or the gauge climbs. The PID data shows the detectable signature arrives well before either event.
A 0.5 mm to 1.0 mm pinhole loses 4 oz to 8 oz of coolant per 30-minute drive cycle at 13 PSI to 16 PSI operating pressure. That loss rate produces no visible puddle on hot San Antonio pavement. It drops reservoir level 0.25 in to 0.5 in per week, below the threshold most drivers notice at a quick glance.
The PID Oscillation Window Telematics Can Identify Early
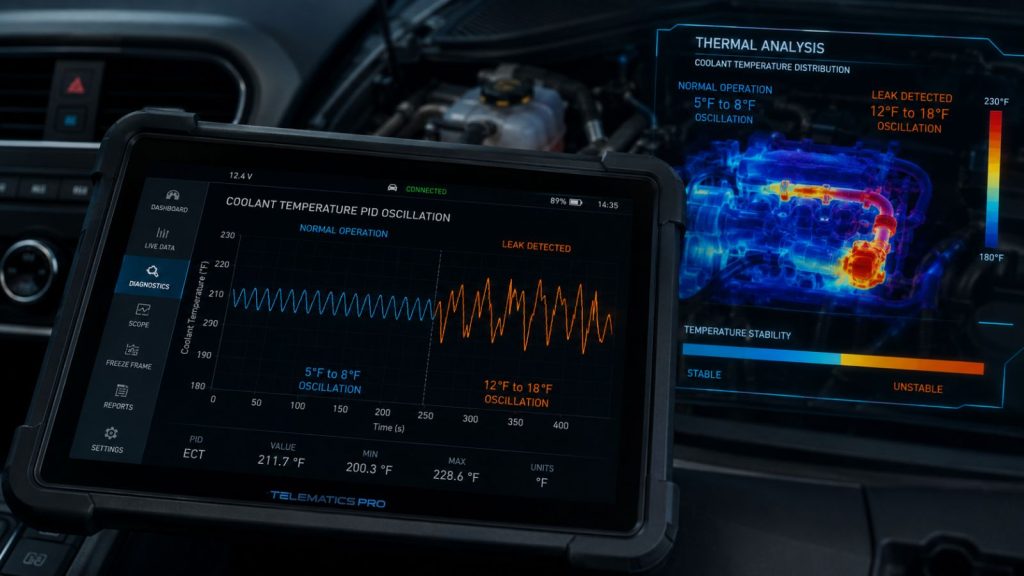
The pressure drop from that cumulative loss reaches 1.5 PSI to 2.0 PSI within two to three weeks of pinhole formation. At that deficit, OBD-II coolant temp sensors lag actual coolant temp by 8°F to 12°F due to air pocket formation near the sensor bung. The result is an erratic PID trace, not a smooth oscillating wave.
Telematics platforms logging at 1 Hz capture that erratic pattern within a single 10-minute drive segment. The driver sees a normal gauge reading. The data shows a cooling circuit under developing stress.
Diagnostic Verdict: On vehicles with confirmed pinhole leaks, PID logs from the 10 minutes prior to the service visit show coolant temp oscillation bands of 12°F to 18°F, compared to the 5°F to 8°F baseline recorded on the same vehicle six months earlier. Diagnostic Verdict: Vehicles presenting with a 1.5 PSI to 2.0 PSI pressure deficit on a shop pressure test consistently match the erratic PID oscillation pattern flagged by telematics in the two to three weeks preceding the diagnostic appointment.
Why San Antonio Stop-and-Go Driving Accelerates Pinhole Leak Consequences
Extended idle in July heat is a stress multiplier. A vehicle idling for 8 to 12 minutes in 104°F ambient with the AC compressor active adds 15% to 22% additional thermal load on the cooling circuit.
On a system already carrying a 1.5 PSI pressure deficit, that idle thermal load pushes coolant temp 15°F to 22°F above normal operating range. The radiator fan cycle cannot compensate fast enough at zero vehicle speed. That temp spike is precisely the PID anomaly telematics systems flag first.
In vehicles we service from the Loop 1604 northwest corridor, we consistently find coolant reservoir levels 0.25 in to 0.5 in below the cold-fill line on vehicles with no visible leak history. The stop-and-go idle pattern on this corridor in July heat cycles the cooling system pressure 8 to 12 times per commute. Pinhole losses totaling 4 oz to 6 oz per trip accumulate below the threshold any driver notices at a weekly glance.
The Pearl and its surrounding Broadway corridor add a second failure pattern. Short-trip driving of 0.5 to 2 miles per stop means the cooling system never fully pressurizes. Each cold-start cycle introduces a partial pressure build, and each shutdown releases it. Over 5 to 8 cycles on a July afternoon, a 0.5 mm pinhole produces cumulative coolant loss of 20 oz to 40 oz without a single visible puddle on a parking structure floor.
Diagnostic Verdict: Vehicles driven primarily in Loop 1604 stop-and-go and Pearl-area short-trip patterns show reservoir losses of 20 oz to 40 oz per week in July, confirmed on pressure test at 1.5 PSI to 2.5 PSI below spec, with no customer-reported puddle or gauge movement preceding the visit.
What Hose Degradation Looks Like Before a Leak Becomes a Puddle
Pinhole leaks do not start from nothing. The physical precursor is hose wall micro-cracking from heat cycling.
EPDM and silicone coolant hoses are rated to 257°F (125°C). In Bexar County, a vehicle parked on a concrete surface in July reaches underhood temps of 180°F to 220°F between drive cycles. That sustained heat cycling degrades the outer hose wall within 4 to 6 years of South Texas service.
The pattern we see most often on Bexar County vehicles with 60,000 to 90,000 miles is surface micro-cracking on the lower radiator hose before any coolant loss registers. When we remove a hose showing visible surface cracking on a South Texas vehicle, the inner wall typically reveals pinhole formations already 12 to 18 months from producing a visible puddle. Those formations are already generating the pressure oscillation pattern that telematics flag as an anomaly.
When a hose feels firm at ambient temp but shows longitudinal surface cracking under flex, it is within the micro-crack-to-pinhole window. The outside looks intact. The inside wall is already compromised.
Diagnostic Verdict: Lower radiator hoses removed from Bexar County vehicles with 60,000 to 90,000 miles and surface micro-cracking consistently show inner wall pinhole formations of 0.5 mm to 1.5 mm diameter, confirming the degradation timeline precedes visible leak symptoms by 12 to 18 months.
What the Diagnostic Process Confirms When Telematics Flag a Coolant Anomaly
A telematics alert is a starting point, not a conclusion. The shop diagnostic process confirms what the data flagged.
The first step is a cold-system pressure test at 13 PSI to 16 PSI, held for 10 minutes. A system holding pressure confirms the telematics alert came from a sensor variance or driving pattern anomaly. A system dropping to 11 PSI to 12 PSI within 5 minutes confirms an active pressure loss source.
When the Pressure Test Confirms What the Telematics Flagged
The second step is a physical inspection of hoses, clamps, the water pump weep hole, and the heater core return line. Pinhole leaks at the 0.5 mm to 1.0 mm stage produce no visible drip under static conditions. A UV dye injection and black-light scan identifies the exact leak point within one drive cycle.
The third step is a live PID pull during a test drive replicating the customer’s route conditions. If the customer drives Loop 1604 in stop-and-go, the diagnostic drive replicates that load. If the alert fired during a short-trip Pearl-area pattern, the diagnostic drive replicates short-cycle cold starts. The PID trace either confirms the anomaly under load or rules it out.
Full cooling system inspection details, including pressure testing, hose evaluation, and UV dye procedures, are covered in Ruben’s heating and cooling services.
For vehicles where the thermostat is also showing plateau temp shifts, the related diagnostic process is covered in our [thermostat failure and engine overheating risks](URL: thermostat cluster page) cluster post.
Diagnostic Verdict: Vehicles where telematics flagged a coolant PID anomaly and the shop pressure test confirmed a drop to 11 PSI to 12 PSI within 5 minutes consistently produced a UV dye leak point identification at the lower radiator hose, water pump weep hole, or heater core return line connection during the same diagnostic visit.
Drivers who have received a telematics coolant alert or notice a slowly dropping reservoir level can have their cooling system pressure-tested at Ruben’s Auto Repair, 7210 Polar Bear, San Antonio, TX 78238, before a pinhole leak becomes a roadside event.
Frequently Asked Questions
Can a pinhole coolant leak cause a breakdown without any warning puddle?
Yes, a 0.5 mm pinhole loses 4 oz to 8 oz per drive cycle, dropping system pressure 1.5 PSI to 2.0 PSI before visible pooling occurs.
What does a coolant leak look like on a telematics report?
Yes, a developing pinhole leak widens OBD-II coolant temp PID oscillation from a normal 5°F to 8°F band to 12°F to 18°F within one drive cycle.
How long do coolant hoses last on a San Antonio vehicle?
No, standard 6-year replacement intervals do not account for Bexar County heat cycling, which produces surface micro-cracking within 4 to 6 years on 60,000-mile-plus vehicles.
Does stop-and-go driving on Loop 1604 make a coolant leak worse?
Yes, extended idle in 104°F ambient with AC active adds 15% to 22% thermal load, pushing a pressure-deficient system 15°F to 22°F above normal operating range.
Can a telematics alert detect a coolant problem before the temperature gauge moves?
Yes, telematics PID logging at 1 Hz identifies the oscillation anomaly from a 1.5 PSI pressure deficit before any gauge movement or puddle appears.